


What’s your experience with Google Analytics?
In the ever-changing digital marketing industry, understanding the behaviours of our target audience and making data-driven decisions is key. Google Analytics has provided a useful foundation for businesses, giving valuable insights into website performance and user interactions.
The recently launched Google Analytics 4 (GA4) stands out as a powerful tool, but its extensive features can be overwhelming.
Our goal is to encourage our clients to expand their digital knowledge so that they can make the most of their online marketing. In this blog post, we aim to educate you on GA4 and provide a quick and easy run-through of the data we find most valuable.
Breaking down the Analytics reports
Let’s break down the key sections that can greatly impact your understanding of user behaviour and decision-making process.
User and Traffic Acquisition
Understanding where your visitors come from is fundamental when creating a marketing strategy.
With Acquisition reports in GA4, we can gain insight into the various sources that lead visitors to our website.
These sources include:
- Direct – This includes visitors who came across your website by typing it directly into their browser (e.g. beechwebservices.co.uk) or clicking on an existing bookmark. These are visitors already aware of you and/or your business.
- Organic Search – This refers to visitors from search engines like Google, Bing or Safari, but not through paid ads. These visits happen when visitors click on website links in organic search results, meaning they found your site naturally through their search queries.
- Paid Search – This source represents any visit caused by clicking on a paid advertisement. For example, text ads, shopping ads and other formats.
- Referral – Referrals are visitors who land on your website after clicking a link on another website.
- Organic Social – Organic Social traffic counts toward visitors who find your website through organic social media posts, profile links on social media, or shares and referrals.
In GA4, we can go deeper than this, and see exactly where a visitor originated from by looking into the source/medium that was used to access your website.
How should you use these reports?
The Acquisition reports help us to identify the most effective channels and sources of our visitors. This helps us build our strategy and allocate marketing resources wisely to the areas online where our ideal customers are.
Engagement
Engagement metrics are like a window into the minds and eyes of our website visitors. By paying attention to the data provided in the Engagement report on GA4, we can gain valuable insights such as:
Which content grabs the attention of our audience?
- Which pages have the highest views and average engagement time?
- Event tracking: Track specific visitor actions for example, button clicks, video views or form submissions. This helps us understand what content motivates visitors to take the desired action.
Where is your website under-performing?
- Where are the high bounce rates (how quickly a visitor clicks away from a page) and low average engagement times? Identify the pages where visitors lose interest quickly. Investigate content quality, relevance, and user experience issues.
- Exit pages: Identify the last pages visitors go to before leaving your site. Analyse their journey to see if there are opportunities to keep them engaged.
- Click-through rates (CTRs): Measure the effectiveness of your calls to action (CTAs).
How can we use these insights for improvement?
- Optimise content: Improve clarity, structure, and visuals to enhance readability and interest from your visitors.
- Adjust website design: Ensure a smooth user experience by improving navigation, eliminating clutter, and optimising mobile responsiveness.
- Improve the user journey: Based on visitor behaviour, create content recommendations or targeted CTAs to engage them.
- Experiment: Test different content formats, layouts, and CTAs to see what resonates best with your audience. Continuously monitor and adapt based on engagement data.
- Remember, engagement metrics are not just numbers; they represent your audience’s voice. By actively listening to what they’re saying through their actions, you can create a website that truly resonates with them, and better achieve business goals.
Conversions
Have you ever wanted to track the actions visitors take on your website?
Looking further into what the Engagement report provides on Google Analytics, we can use the data provided by Conversions to watch how our visitors interact with specific points of engagement and calls to action.
The Conversions report provides a detailed overview of your conversion events, from a phone call to a completed purchase or a form submission. By tracking and analysing conversion data, we can optimise our website to improve the user journey and conversion rates.
We can measure a variety of conversions using these reports and set up custom tracking to watch out for specific actions a visitor takes on our website. This is especially helpful when considering online campaigns.
Measuring conversions through Google Analytics puts all this data in one place, making it easy to refer to when planning future online strategies.
Pages and Screens
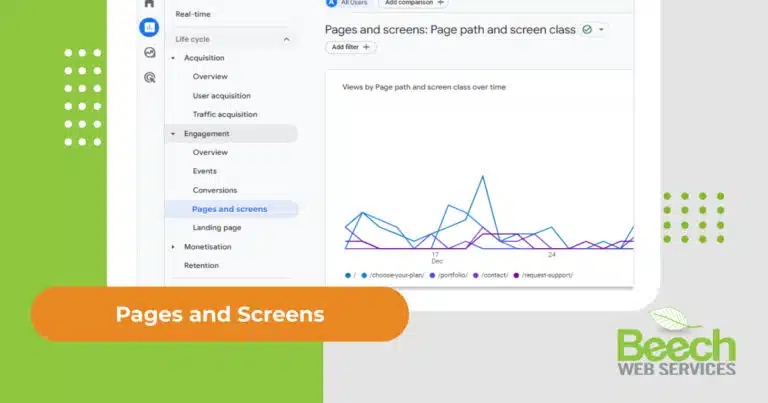
These reports allow us to explore the performance of individual pages or screens on a website. This insight is invaluable for identifying high-performing content, optimising user pathways, and addressing potential bottlenecks in the user experience.
The Pages and Screens report in Google Analytics 4 is a vital tool for understanding how users interact with your website. It goes beyond simple page views, offering detailed insights into user engagement, content performance, and user journeys.
Here’s why it’s so useful:
- Identify: See which pages/screens get the most views, average session duration, and even conversions. This helps us understand what content resonates with our audience and focus our efforts on creating similar valuable content.
- Discover: Which pages/screens are underperforming. Pinpoint pages/screens with low engagement or high bounce rates. This allows us to diagnose issues, such as irrelevant content, poor usability, or slow loading times, and take action to improve them.
- Track: Monitor changes in views and engagement over time for specific pages/screens. This helps us understand how content resonates with users in the long run and identify content needing a refresh or removal.
- Visualise the user journey: See how users navigate our website and identify potential bottlenecks or confusing steps.
- Measure: We can measure specific user interactions, such as scroll depth, clicks/taps and form completion rates. This allows us to see exactly how our audience chooses to engage with our website content.
Beyond these core benefits, the Pages and Screens report offers various customisation options and integration with other GA4 features to delve deeper into user behaviours and tailor our websites for the best user experience.
Remember, the key to unlocking the full potential of the Pages and Screens report lies in asking the right questions. Define your goals, analyse the data thoughtfully, and implement data-driven changes to create a website that truly engages your visitors.
Tech details
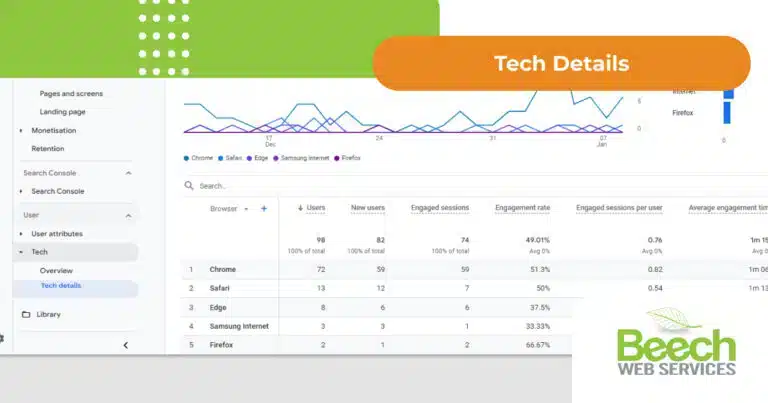
The Tech reports offer essential information for any website owner who values how their visitors are viewing them online. Understanding the technical aspects of user interactions can influence how we optimise our websites, ensuring a seamless experience across various platforms and devices.
Unpacking these reports:
- Browsers: To accommodate as much of our target audience as possible, it is worth accounting for the various browsers people use. While some may favour Google Chrome, likely, other browsers such as Safari, Edge and Firefox could also be used by visitors. Knowing this helps us prioritise compatibility testing and optimisation for dominant browsers.
- Devices: Is our target audience an on-the-go mobile searcher? Or are they finding us through their desktops and laptops? The tech reports can help us to identify this and create responsive website designs that are adaptable and compatible with these devices.
- Screen resolution: Much like the different device types, it’s essential to know what our website will appear like for our customer. Websites developed according to smaller screen resolutions may not have the desired effect when adapting to a larger screen and vice versa. We’d recommend optimising any website for multiple device resolutions.
The tech reports help to identify even more about our audience, enabling us to create websites that appeal to them and encourage their engagement. These insights help us plan for future compatibility and ensure that our website is always prepared for future technological changes and innovations, for example, a new browser or phone model.
These reports are a powerful tool for any website owner who wants to ensure a seamless experience for every user, regardless of their technical setup. By digging deep into the data, we can optimise our website for maximum engagement and reach our target audience across all platforms.
In summary
There you have it! Google Analytics 4 contains many reports and methods of analysing our website and visitor data, and we recommend that every business owner familiarises themselves with at least the ones we’ve discussed. Knowing our audience is key to creating effective business and marketing strategies. The data is only the start!